WIN Career Readiness System

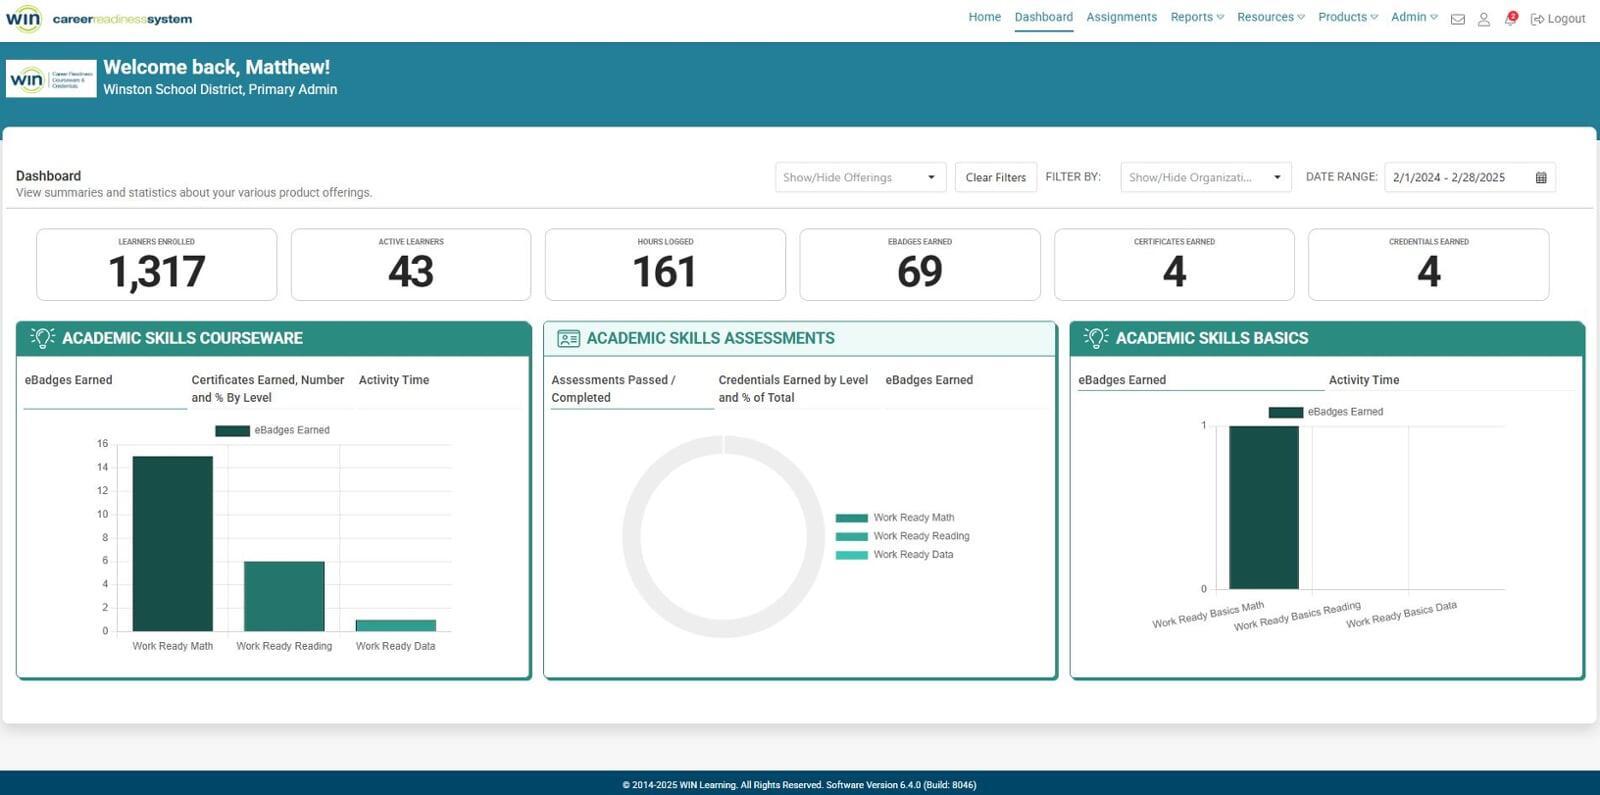
Administrator Dashboard
Administrators and facilitators can view immediate learner progress from the Career Readiness System dashboard. The dashboard includes at-a-glance summary data on eBadges, certificates and credentials earned, total time spent in the courseware, and more. Administrators can select a time stamp or period to manage and monitor progress for all courseware and credentials. The system allows for easy rollover, drill-down views and printable access to selected reports, all from a single streamlined dashboard.
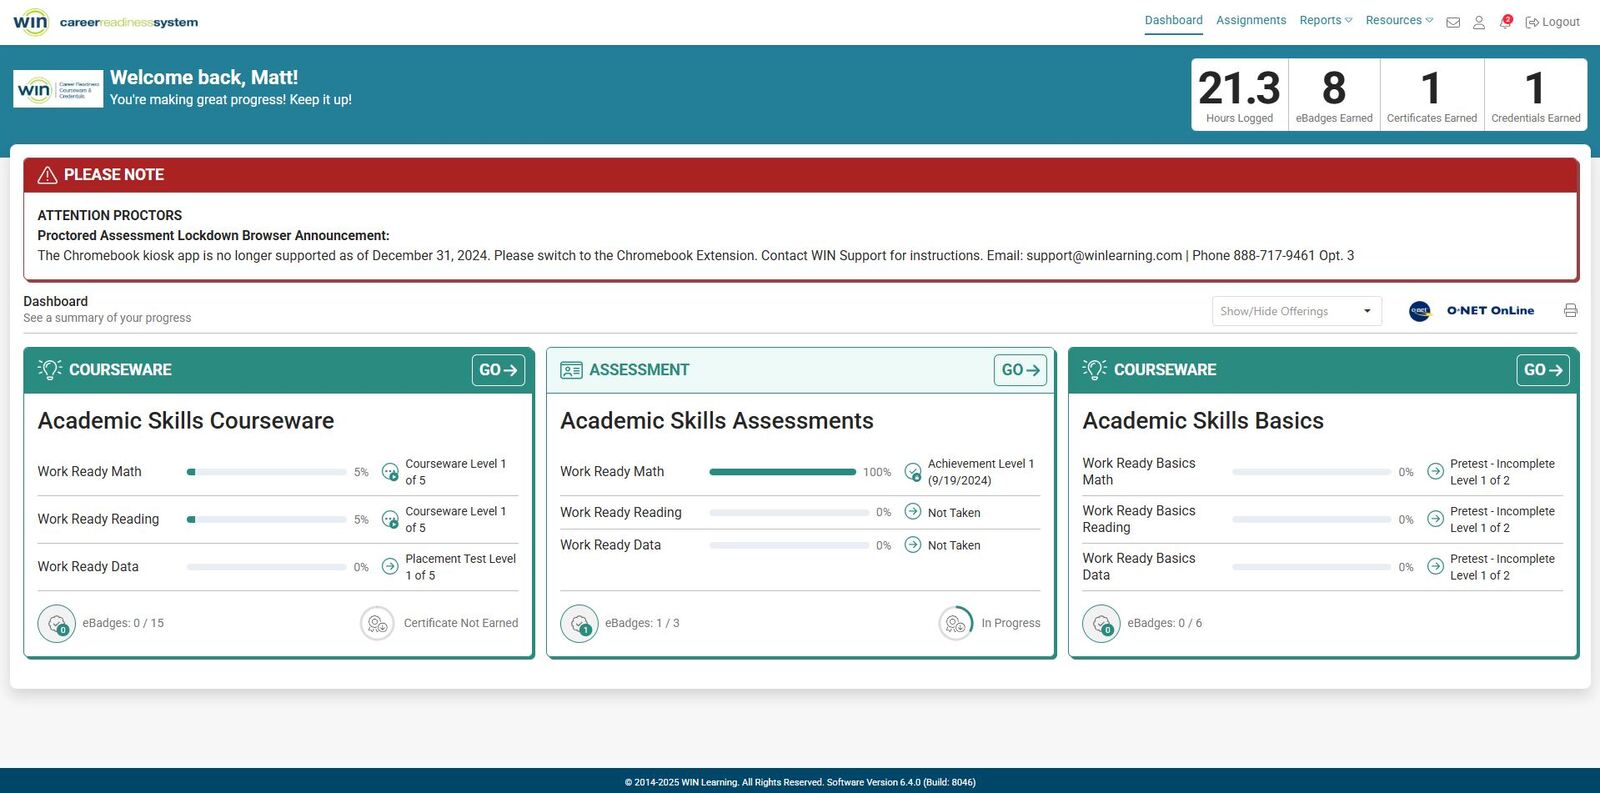
Learner Dashboard
When learners login to WIN CRSystem, they see tiles for each of their courseware and assessment solutions that display their progress, most recent scores, and how many eBadges they’ve earned. Counters at the top of the dashboard show the total number of hours they’ve logged in the system, and the number of eBadges, certificates, and credentials they’ve earned. Learners can filter their dashboard view to only display selected solutions. To launch a solution, learners click “Go” in the top right corner of the tile.