
WIN Career Readiness System

Reports
Dashboard Menu
Learner Listing Report generates detailed reports on accessed products for all learners at one or more sites. All reports are product specific and may be different than the report displayed below. To download the report, click on the Excel icon  .
.
To run a Learning Listing Report, click on the Reports tab at the top of the dashboard screen, then select Learner Listing from the dropdown.
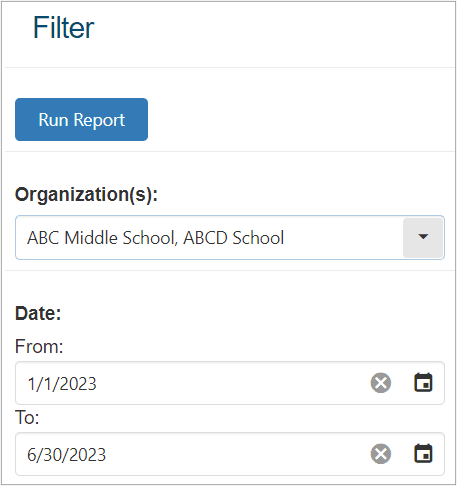
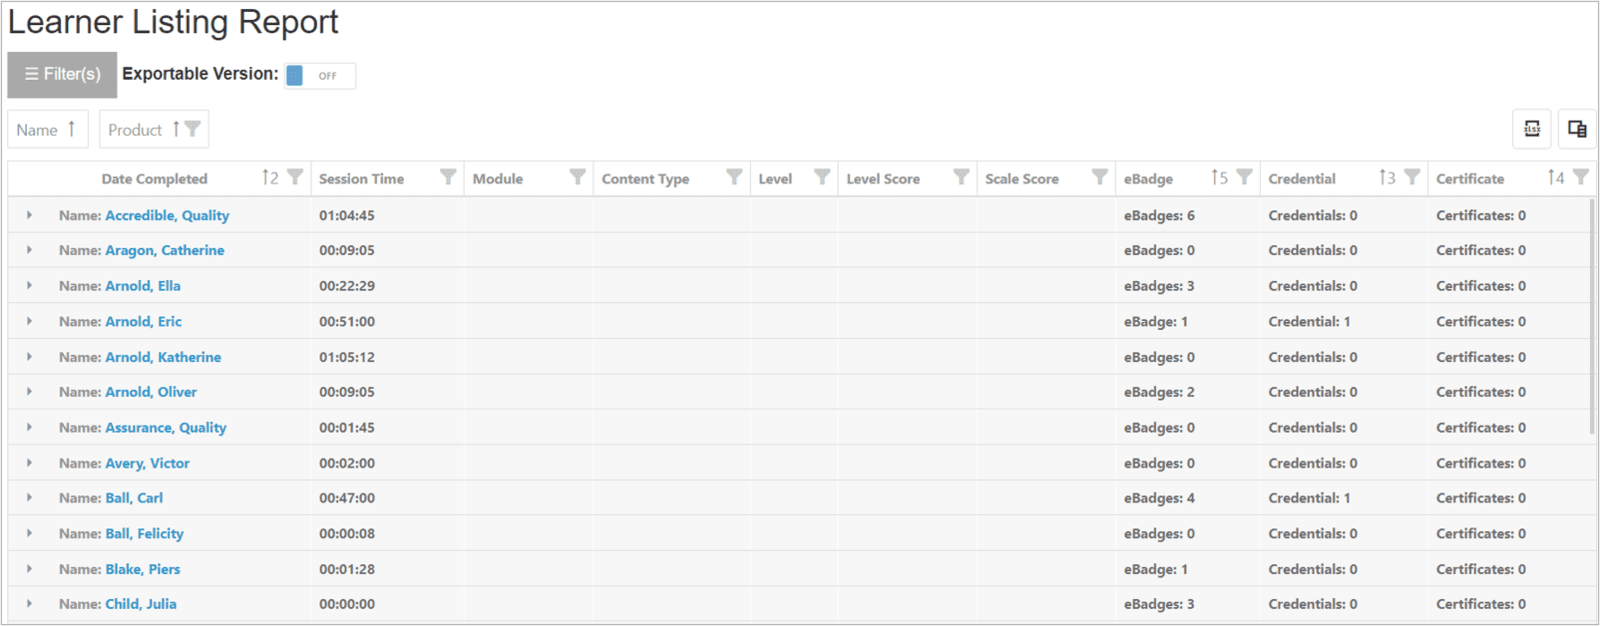
Next, select one or multiple site(s) to generate the report. Narrow down the results by selecting a date range or leave it blank to see all data, then click Run Report. A quick view will appear showing the total Session Time and eBadges, Credentials, and Certificates earned.
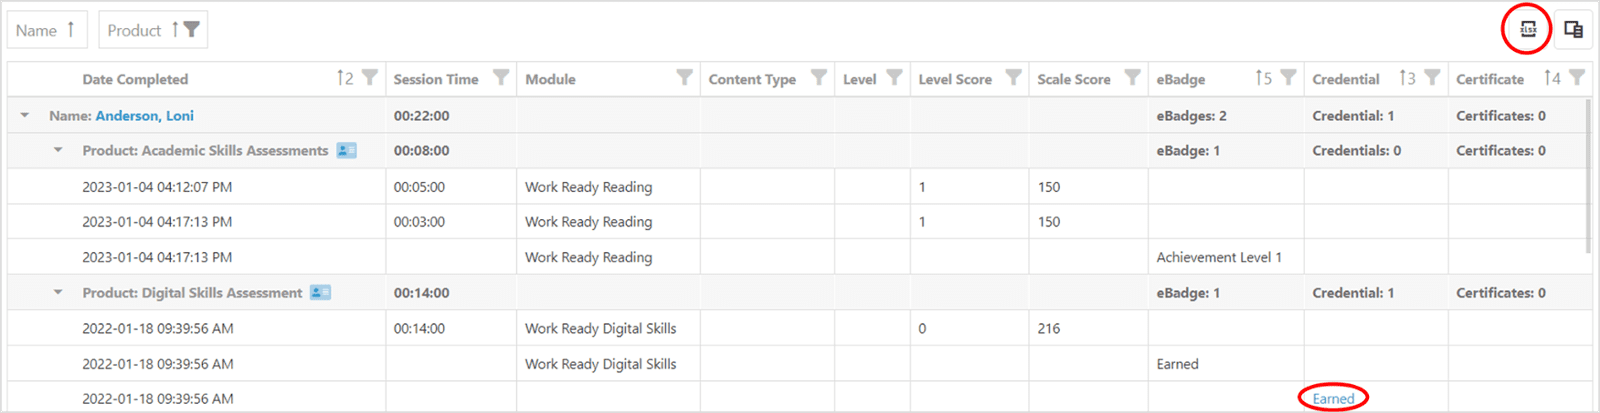
Select the arrow next to the Learner name to see specific product usage information like Date Completed, Session Time, Module, Content Type, Level, Level Score, Scale Score, eBadge, Credential, and Certificate. Click on Earned in the Credential column to download a printable .pdf version of the learner's credential. The report shows the Scale Score the learner earned, the level (if applicable), and the Session Time. The Excel icon in the top right of the report exports the data to an Excel spreadsheet.
Session time is displayed per product offering, as well as total time for the products selected. Filter the data by selecting any of the filter icons. ![]() Click the arrow
Click the arrow ![]() on any of the fields to sort the data alphabetically or numerically, depending on the field. The Excel icon at the top right of the report exports the data to an Excel spreadsheet. When data is exported, all learner data will expand.
on any of the fields to sort the data alphabetically or numerically, depending on the field. The Excel icon at the top right of the report exports the data to an Excel spreadsheet. When data is exported, all learner data will expand.
Click on the learner’s name in the far left column to view the learner’s Individual Learner Report.
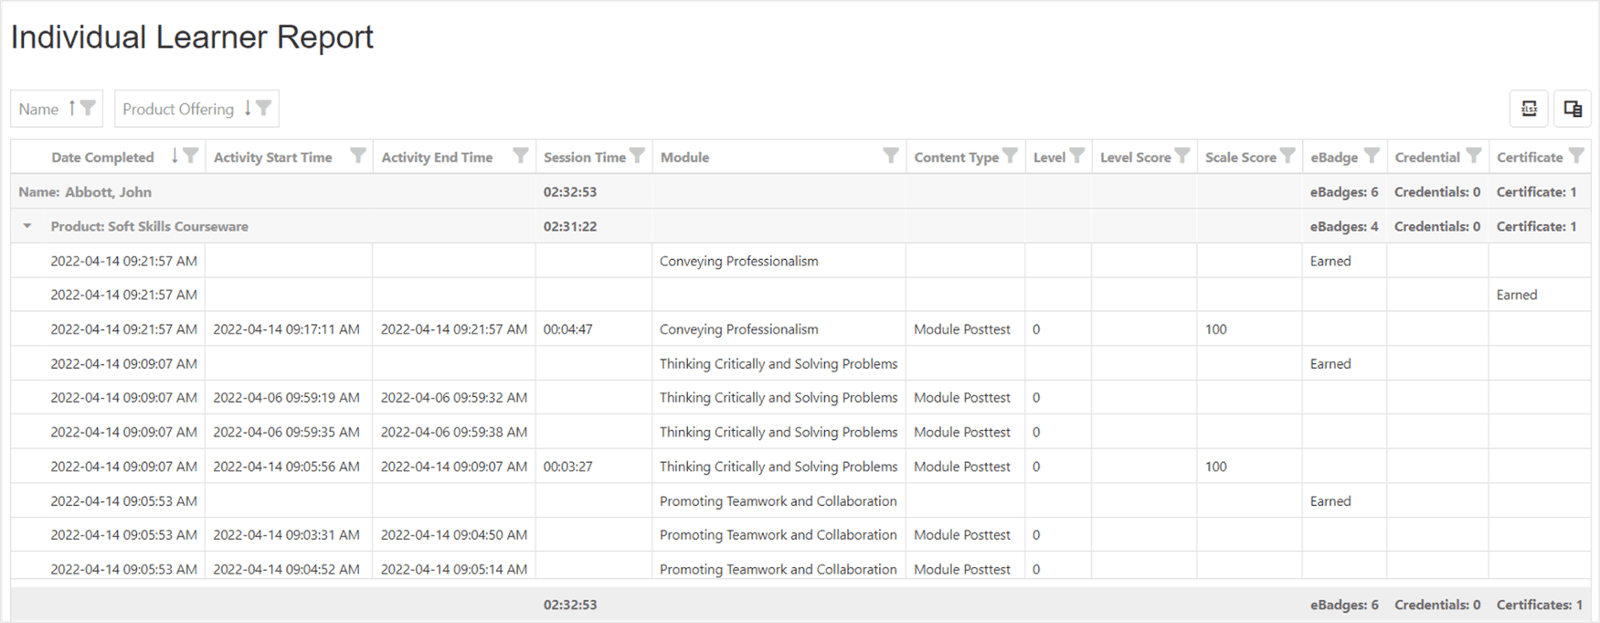
Individual Learner Report produces detailed scores and activity associated with a specific learner across product offerings. To run an Individual Learner Report, click on Reports in the top menu and select Individual from the dropdown menu.
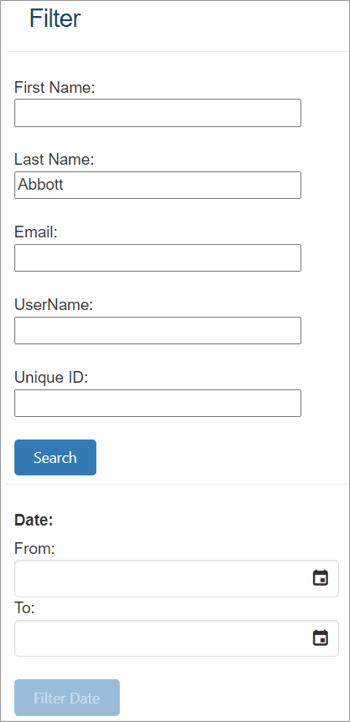
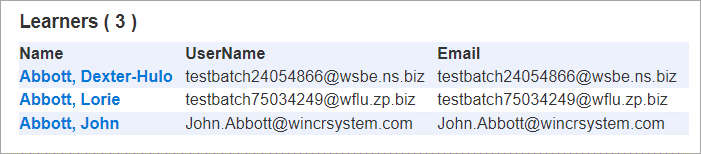
Locate the learner by typing in their First Name, Last Name, Username, and/or Unique ID, then click Search. To see activity during a specific date range (optional), enter a From Date and To Date and click Filter Date. Learners will be listed at the bottom of the screen to the right. Select the learner from the list to view their Individual Learner Report.
Specific product information will be displayed like Date Completed, Session Time, Module, Content Type, Level, Level Score, Scale Score, eBadge, Credential, and Certificate. Filter the data by selecting any of the filter icons ![]() . Clicking the arrow
. Clicking the arrow![]() . Clicking the arrow on any of the fields will sort the data alphabetically or numerically, depending on the field. The Excel icon at the top right of the report exports the data to an Excel spreadsheet.
. Clicking the arrow on any of the fields will sort the data alphabetically or numerically, depending on the field. The Excel icon at the top right of the report exports the data to an Excel spreadsheet.
To run a Class Report, click on the Reports tab at the top of the dashboard screen, then select Class Report from the dropdown.
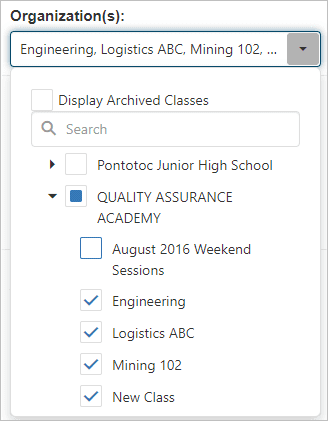
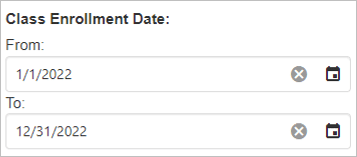
Select the class or classes by using the organization search box. The classes displayed will populate based on the user’s permission level. Facilitators will only see the classes to which they are associated. Select a date range if desired, then click Run Report.
NOTE: The date range filter on the class report is tied to CLASS ASSIGNMENT, not activity. The date(s) entered in the date range will find the list of included learners according to when the learners were enrolled in that class. The class report date range does NOT bind activity so if the learner is included in the report, their total activity will be included. Their activity will not be tied to the date range selected.
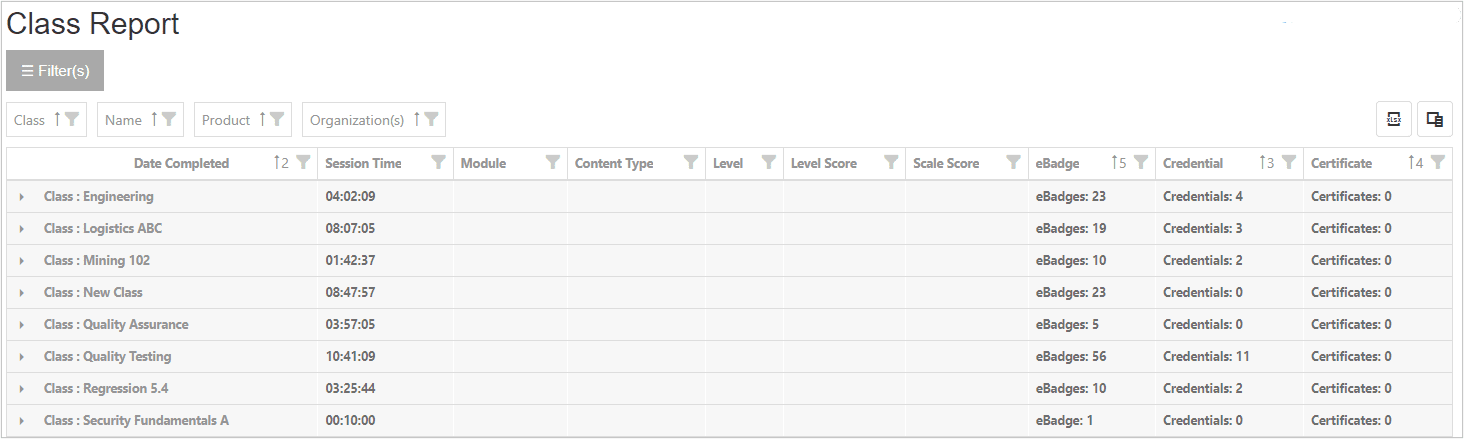
The Class Report will display a summary view of the class(es) selected. The summary data includes:
● Class Name
● Total Class Session Time
● Number of eBadges earned
● Number of Credentials earned
● Number of Certificates earned
NOTE: Class data is not totaled across classes. If a student is enrolled in more than one class simultaneously, both class reports will show the exact same activity for that student. Therefore class report data is not aggregated into grand totals. Do not try to manually total class data because the duplicate student entries will cause inflation of the data. For activity totals across an organization, please refer to the General Summary or Credential Summary Reports.
Expand the class to see a list of learners in the class and a summary for each learner.
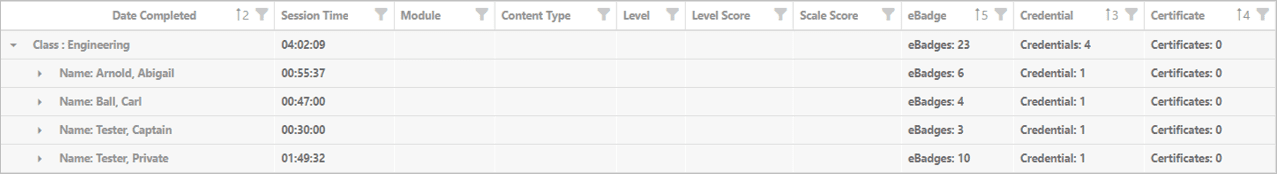
Expand the individual(s) to see detailed data for each learner.
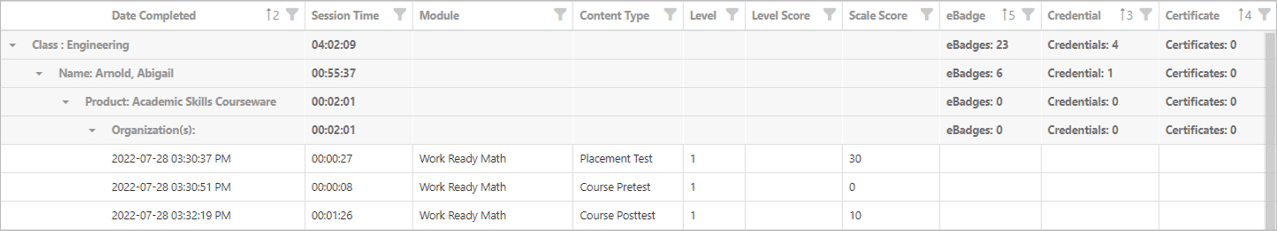
NOTE: All historical activity for each learner will be included in the class report, which means that even the activities completed before the learner was enrolled in the class will be included.
Filter your selection by any of the headings: Class, Name, Product, Module, Content Type, etc. Export the Class Report by clicking the Excel icon in the upper right corner.
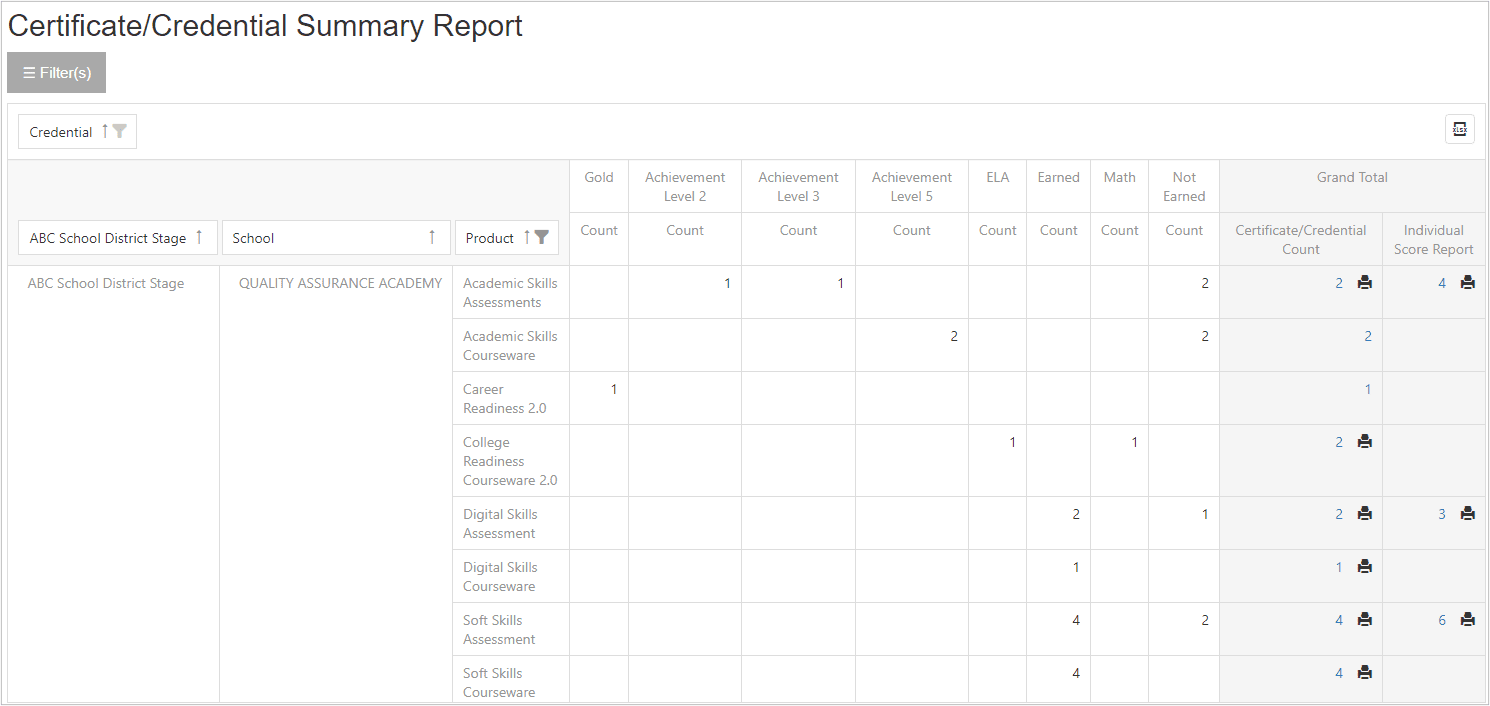
Credential Summary Report shows how many learners earned and did not earn a credential. These credentials are earned when a learner successfully passes a proctored assessment. To run a Credential Summary Report, click on the Reports tab at the top of the dashboard screen, then select Credential Summary from the dropdown menu.
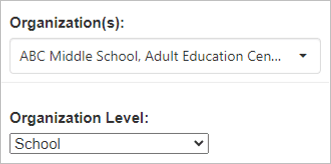
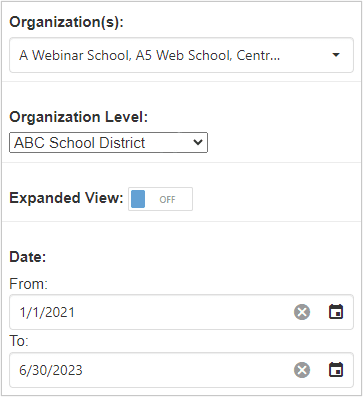
Next, select the organization or location(s) from the organization search box. Select the Organization Level (District, School, etc.) and enter a date range if desired. You may have access to an arrow next to the organization box which provides a dropdown list of sites belonging to your organization. Use this feature to run a report for a specific site.
Below is an example of the Credential Summary Report.
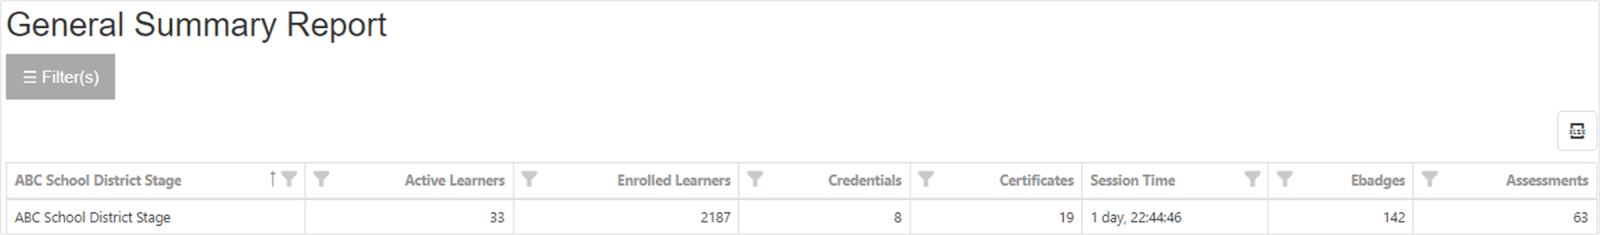
General Summary Report provides activity results in all product offerings for all learners in one or more locations. To run a General Summary Report, click on the Reports tab at the top of the dashboard screen, then select General Summary from the dropdown menu. Next, select the organization(s) that you would like to see listed in the report. You can also set a date range for the report. Click Run Report.
If Expanded View ![]() is off, a summary of usage for all selected schools will populate. In this view, you can filter
is off, a summary of usage for all selected schools will populate. In this view, you can filter ![]() by Active Learners, Enrolled Learners, Credentials, Certificates, Session Time, eBadges and Assessments.
by Active Learners, Enrolled Learners, Credentials, Certificates, Session Time, eBadges and Assessments.
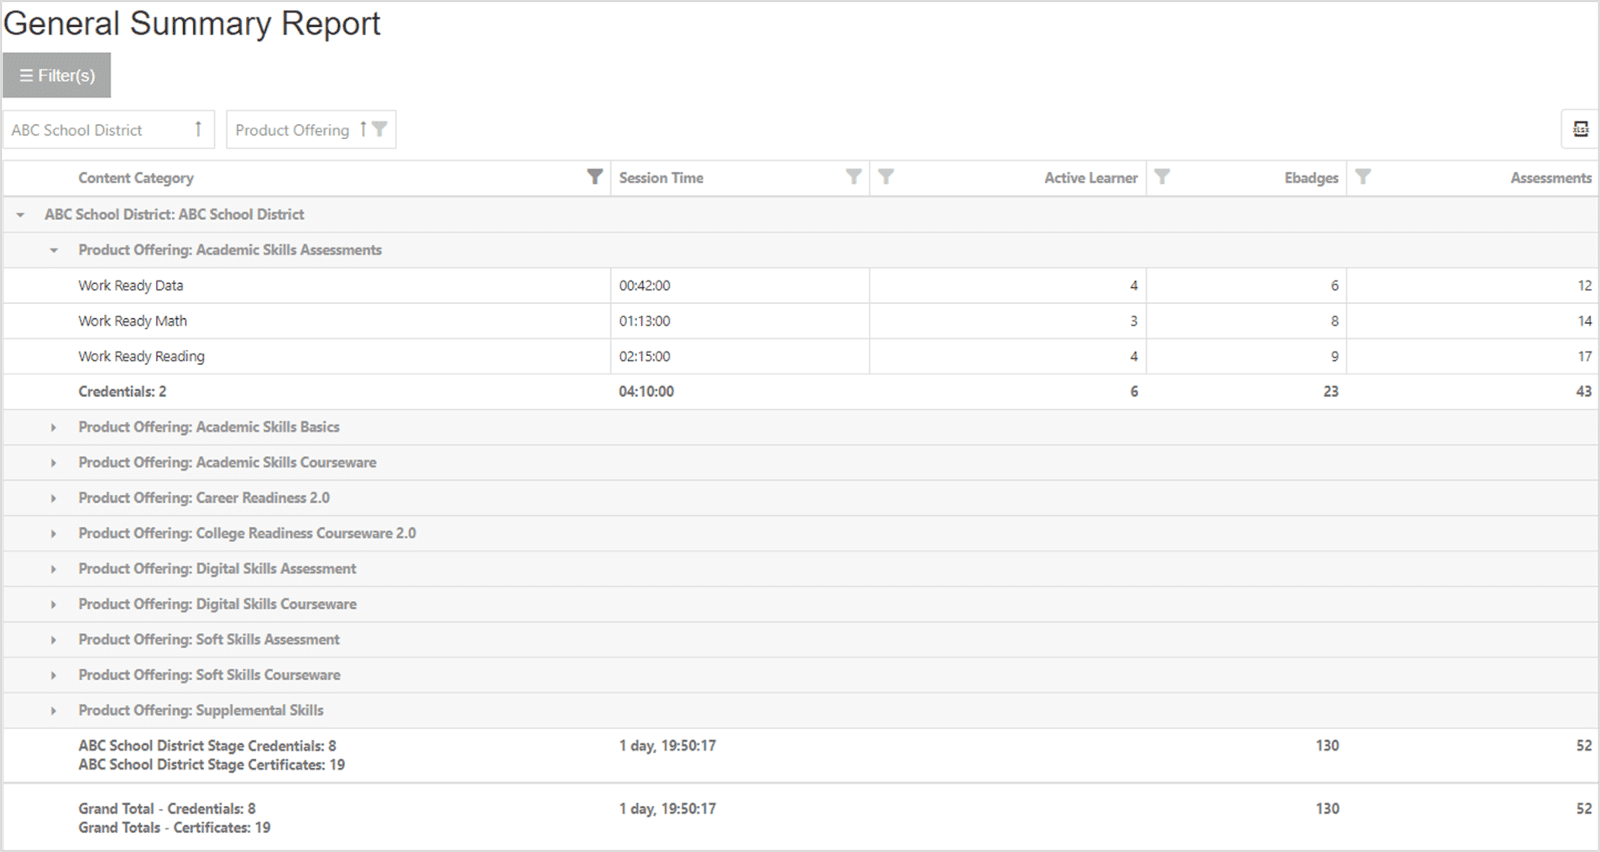
If the Expanded View is on, the locations selected will populate separately. In addition, specific usage within the course modules will appear. In this view, you can filter by Content Category, Session Time, eBadges and Assessments.
To turn the Expanded View off, select the button next to the date range ![]() or choose the arrow button
or choose the arrow button ![]() next to the location name or product. The Excel icon at the top right of the report exports the data to an Excel spreadsheet.
next to the location name or product. The Excel icon at the top right of the report exports the data to an Excel spreadsheet.
The Enrollment Report offers several views into the enrollment data for learners. Teachers and administrators can run the report based on initial creation date within one or more organizations or current enrollment within one or more organizations.
- Initial creation displays learners who were initially created in the selected organization(s) during the date range selected.
- Current enrollment displays learners who are currently enrolled in the selected organization(s) during the date range selected, regardless of where they were initially created.
- Select the organization(s) for which you want to see the data.
- Then select either the Initial Creation Date or Current Enrollment Date filter.
- Then select the date range for which you want to see the data. (Optional)
- Then select Run Report.
Initial Creation Date
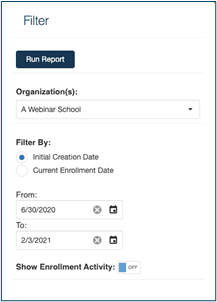
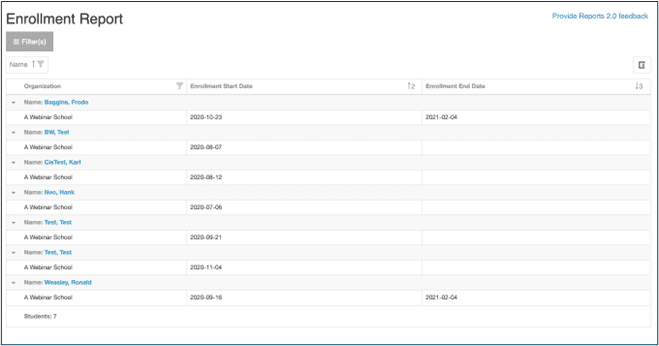
The above snapshot shows the learners who were initially created in A Webinar School between 6/30/2020 and 2/3/2021. At the bottom of the page is a total number of students and pagination controls (if results span pages). This view can be used by an administrator or facilitator to see how many new students were created in a specific organization, during a specific time period.
Use the column filters if desired to filter by Organization, Enrollment Start Date, or Enrollment End Date. Use the Name filter to filter by selected learners. Click on the learner’s name to go directly to their Individual Report.
To see the learners’ enrollment activity, toggle Show Enrollment Activity to on and click Run Report. This will show the learners’ initial enrollment and any subsequent enrollment activity (transfers). The date range only binds the initial creation date in this case, so subsequent enrollments outside of the date range selected could be displayed.
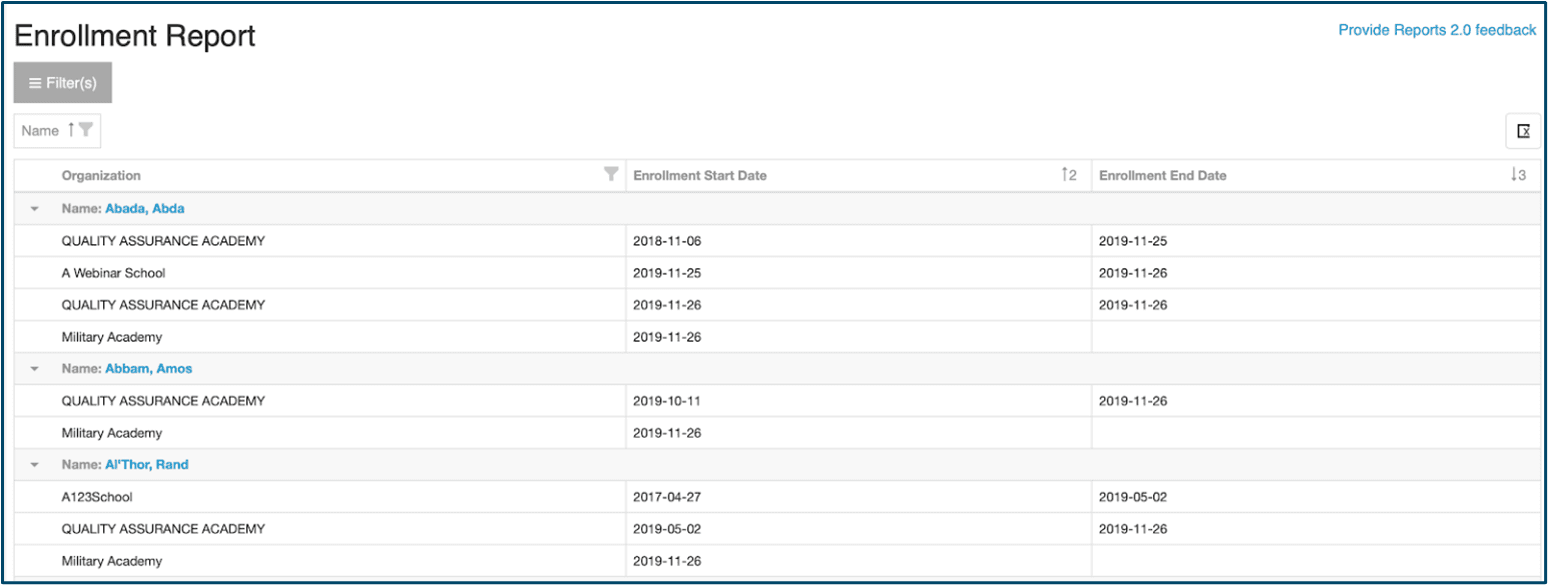
Current Enrollment Date
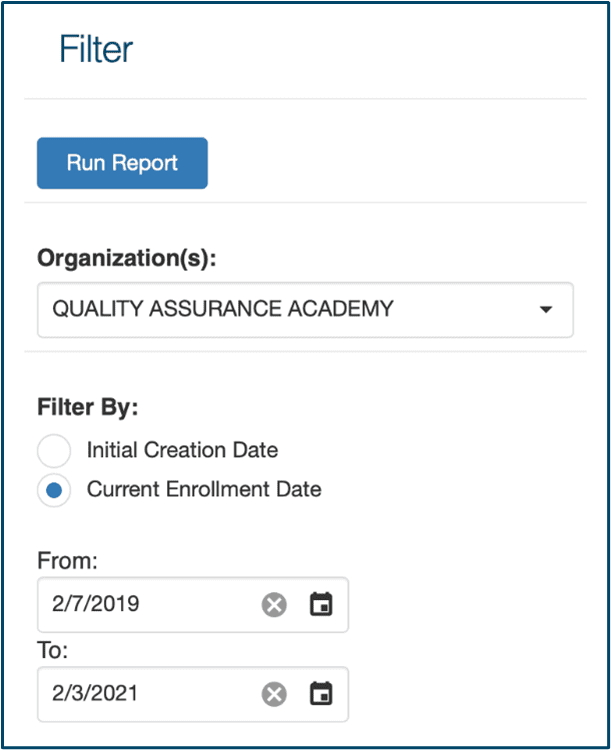
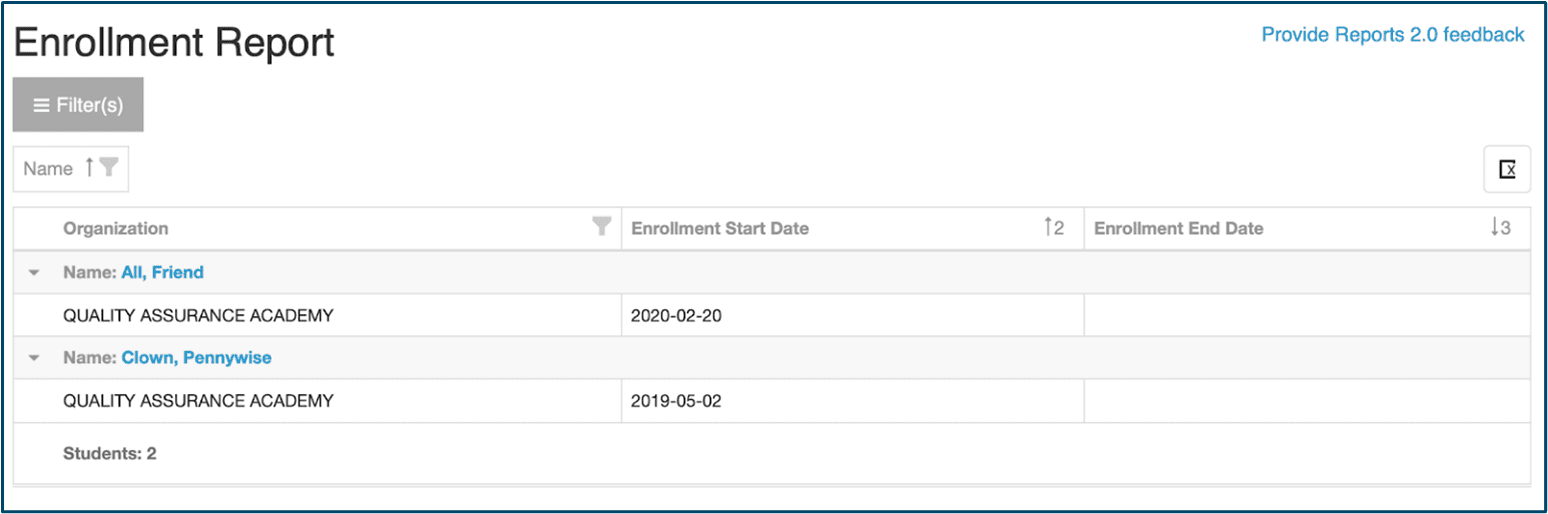
The above snapshot displays two learners whose current enrollment is in the selected organization(s) and falls within the selected date range. These learners might have been created somewhere else at a previous time, but they are currently enrolled in Quality Assurance Academy.
 on any of the fields will sort the data alphabetically or numerically, depending on the field.
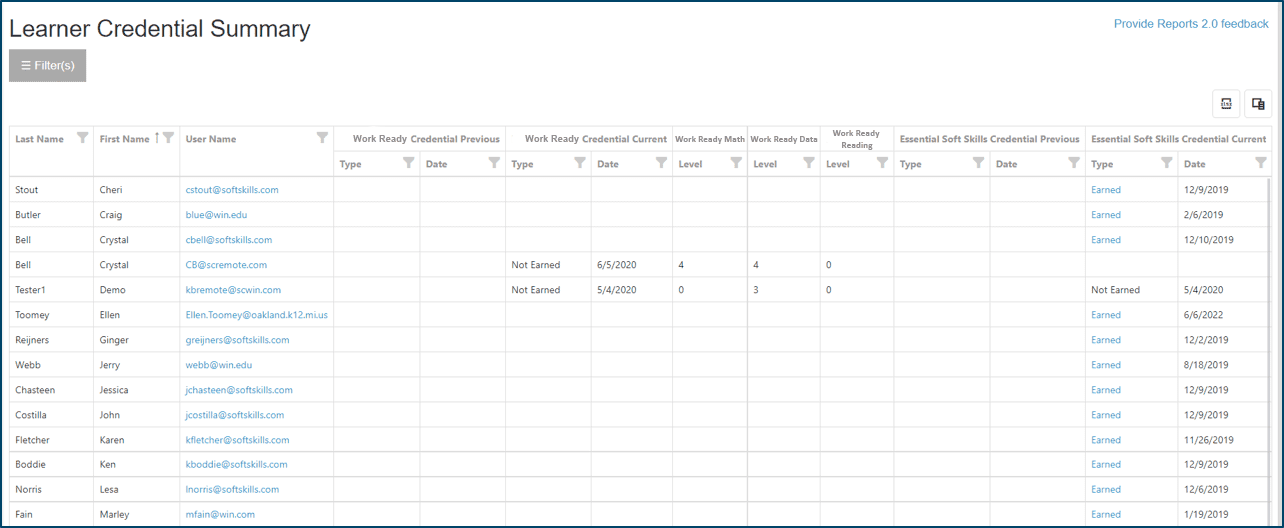
There are four types of Objective Based Reports: Learner Listing, Class, Summary, and Individual. The objective based reports are available for Academic Skills Courseware, Academic Skills Assessments, Soft Skills Courseware, Soft Skills Assessment, Digital Skills Courseware, and Digital Skills Assessment. The reports display mastery by learning objectives.
The summary report shows the number of students in the selected organization who have mastered | not mastered the objectives in the selected date range for the selected Objective Groups(s).
In this example, five learners mastered the objective “Effective listening, speaking, writing,” and 16 learners did not master the objective in the Soft Skills Courseware. In the Soft Skills Assessment, four learners mastered the objective and six did not.
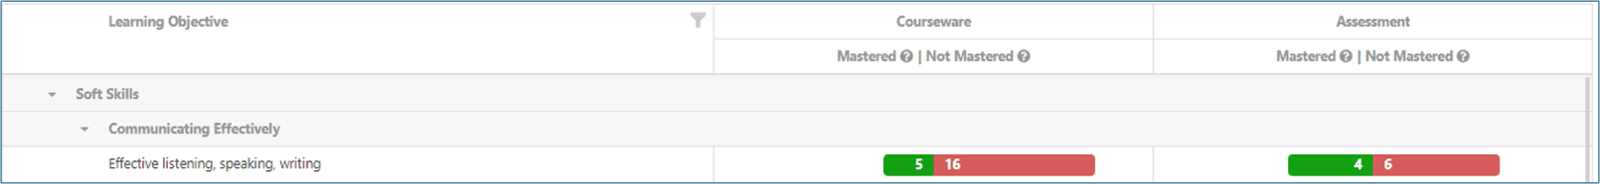
The report is organized by organization, objective group, content category, and learning objective.
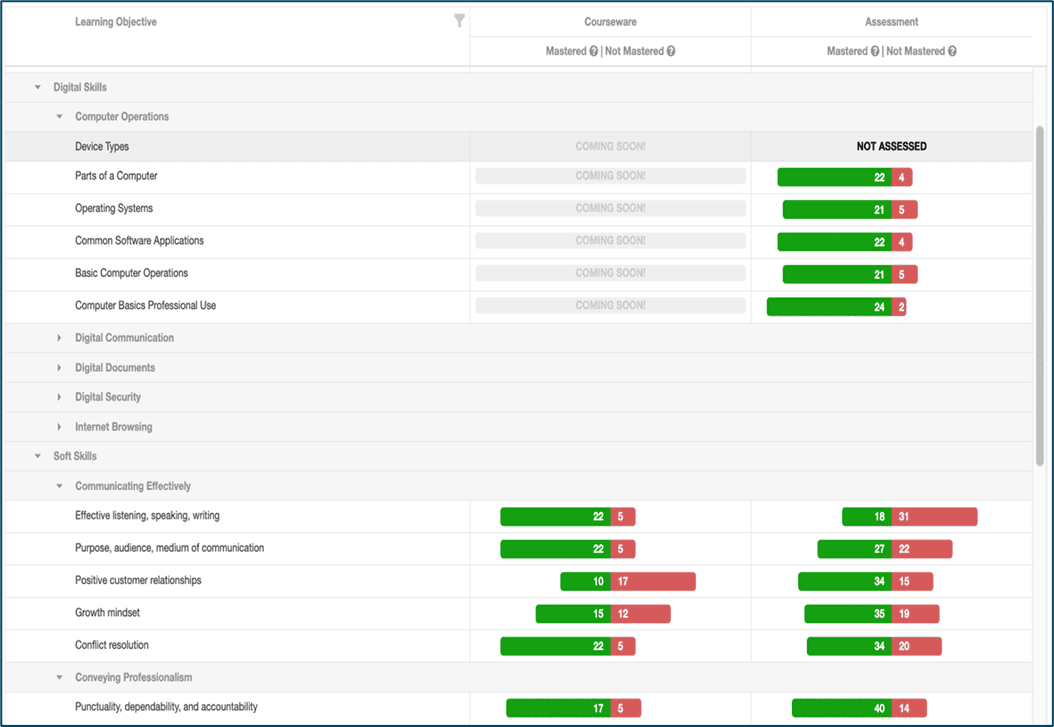
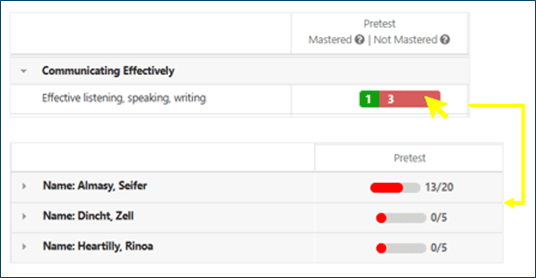
Users can click on the red or green bar on a learning objective in the Summary report to generate the Learner Listing report for the learners that make up that data point.
The individual report shows the individual’s mastered | not mastered performance per objective in the courseware and/or assessment. In this example Rinoa did not master the objective “Effective listening, speaking, and writing” in the Soft Skills Courseware module Communicating Effectively, but she did master the other objectives in the courseware module and she mastered all of the objectives in the assessment. 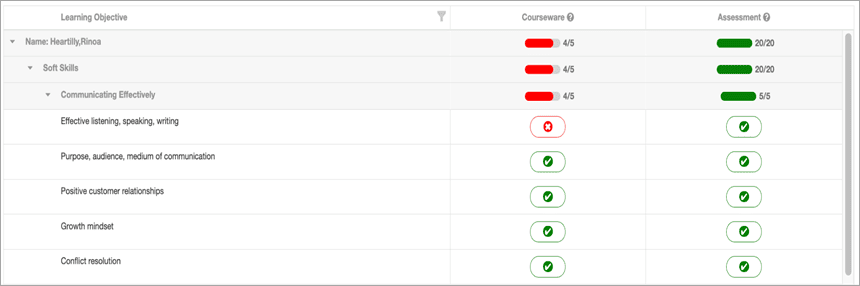
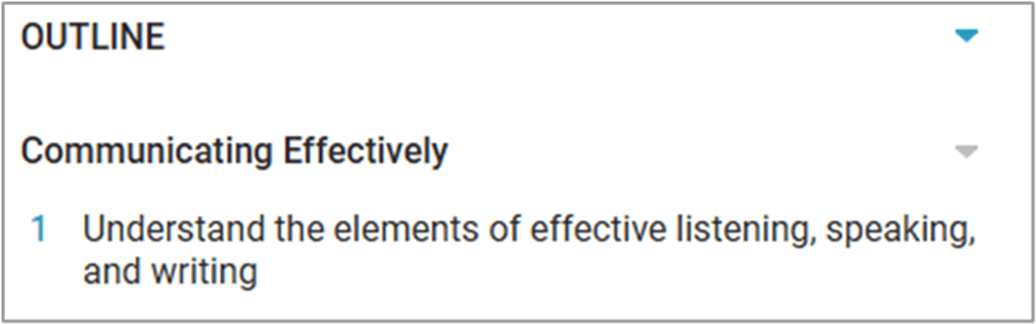
Rinoa can remediate this objective by going to Soft Skills Courseware and reviewing Communicating Effectively Lesson 1 as indicated in the course outline.
Key of Icons:
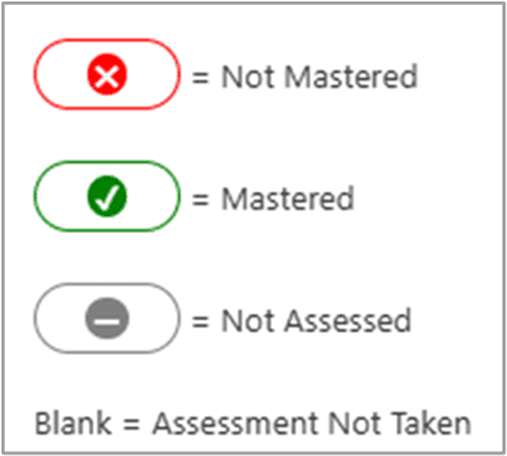
Not Mastered = The student was presented a question/set of questions aligned to the objective and either got the question wrong or skipped it.
Mastered = The student answered all questions aligned to the objective and answered them correctly.
Not Assessed = there are objectives that may be taught and assessed in the courseware but not assessed in the proctored assessment. This is currently true of Digital Skills Assessment. If a learning objective is not assessed the grey icon will be displayed.
Blank = The student did not take the assessment and therefore there is no data for the learning objective.